TABLE 15-6
Given below are results from the regression analysis on 40 observations where the dependent variable is the number of weeks a worker is unemployed due to a layoff (Y) and the independent variables are the age of the worker (X₁), the number of years of education received (X₂), the number of years at the previous job (X₃), a dummy variable for marital status (X₄: 1 = married, 0 = otherwise), a dummy variable for head of household (X₅: 1 = yes, 0 = no) and a dummy variable for management position (X₆: 1 = yes, 0 = no).
The coefficient of multiple determination (R) for the regression model using each of the 6 variables Xⱼ as the dependent variable and all other X variables as independent variables are, respectively, 0.2628, 0.1240, 0.2404, 0.3510, 0.3342 and 0.0993.
The partial results from best-subset regression are given below:
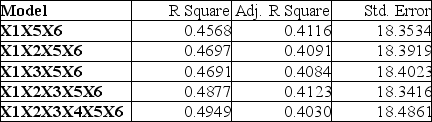
-Referring to Table 15-6, the variable X₁ should be dropped to remove collinearity.
Definitions:
Evolutionary Principles
Concepts based on evolution, explaining how natural selection and adaptation contribute to the behavior and traits of organisms.
Mental Shortcuts
Cognitive strategies that simplify decision making by reducing the amount of information processed.
Cognitive Misers
A theory suggesting that humans, in an effort to conserve mental energy, prefer to rely on simple and efficient thought processes rather than engaging in more effortful and complex reasoning.
Judgements
Judgements are opinions or decisions formed after considering facts and evidence, often involving the evaluation of information to draw conclusions.
Q9: Referring to Table 15-1,does there appear to
Q23: Referring to Table 14-19,what is the estimated
Q52: Referring to Table 14-4,what are the residual
Q93: Changes in the system to reduce common
Q105: Referring to Table 14-19,there is not enough
Q121: Referring to Table 17-8,based on the R
Q156: Referring to Table 14-13,holding constant the effect
Q225: Referring to Table 14-19,what should be the
Q228: Referring to Table 14-17 Model 1,what is
Q309: When an explanatory variable is dropped from