TABLE 17-3
A quality control analyst for a light bulb manufacturer is concerned that the time it takes to produce a batch of light bulbs is too erratic.Accordingly,the analyst randomly surveys 10 production periods each day for 14 days and records the sample mean and range for each day.
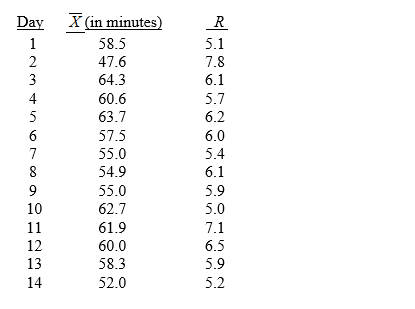
-Referring to Table 17-3,suppose the analyst constructs an  chart to see if the production process is in-control.What is the lower control limit (LCL) for this chart?
Definitions:
Q3: Referring to Table 17-9,construct an R chart
Q23: The first learning curve was developed by
Q41: Which one of the following is an
Q56: Referring to Table 17-4,suppose the supervisor constructs
Q65: Referring to Table 7-1,what is the probability
Q97: Referring to Table 14-15,which of the following
Q110: Referring to Table 17-9,based on the R
Q144: Referring to Table 16-12,using the regression equation,what
Q220: Referring to Table 19-2,the return to risk
Q302: Referring to 14-16,what is the correct interpretation