A faculty advisor was interested in determining whether there is a difference in the amount of time (in hours) spent studying on weeknights (Monday through Thursday) between male and female students. The advisor selected a sample of 12 female students and a second independent sample of 10 male students and asked each student to indicate the average amount of time they spend studying on a weeknight. The following summary statistics are obtained. 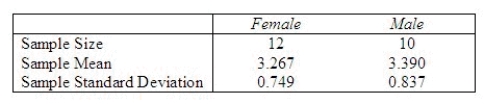 The advisor assumed equal variances in the analysis. Is this a reasonable assumption? Perform the appropriate test of hypothesis to determine whether there is a significant difference in average time spent studying on weeknights between male and female students Test using
  = 0.05.
Approximate the p-value for the test in part (c). Using the p-value approach and  = 0.10, what conclusion can be drawn about the difference in average time spent studying on weeknights between male and female students? Develop a 95% confidence interval for the average amount of time spent studying on week nights by females.
Test Statistic = ______________
Reject Region: Reject H0 if |t| > ______________
Conclusion: ______________
One ______________ conclude that there is a significant difference in average time spent studying on weeknights between male and female students.
P-value = ______________
Using the p-value approach, one ______________ conclude there is a significant difference in average time spent studying on weeknights between male and female students.
What is the 95% confidence interval? (CI)
CI = ______________ Enter (n1, n2)
Definitions:
Producing Online Movie Rentals
The business activity of offering movies for rent through internet platforms.
Cost To The Firm
The total expenses incurred by a company in producing goods or providing services.
Original Curve
Refers to the initial state or baseline condition of a graphical representation before any changes or impacts are applied.
New Curve
In economic contexts, refers to a shifted demand or supply curve due to changes in factors affecting them, such as consumer preference or production costs.
Q18: In testing the difference between two population
Q40: In simple linear regression, the plot of
Q45: A Type I error is represented by
Q70: The manager of an ice cream store
Q84: An experiment was conducted to test the
Q103: In one-way ANOVA, suppose that there are
Q104: The value of F that locates an
Q132: The sample size in each independent sample
Q200: In testing the difference between two population
Q240: The sampling distribution of the quantity <img