Figure: Production Possibility Frontier Curve for Tealand
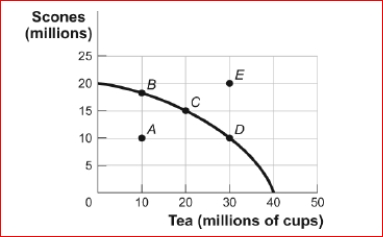
 (Figure: Production Possibility Frontier for Tealand) Look at the figure Production Possibility Frontier for Tealand.In the figure, Tealand is producing at point C on its production possibility frontier.What is the opportunity cost in Tealand of increasing the production of tea from 20
million cups to 30 million cups?
A.10 million cups of tea
B.5 million scones
C.10 million scones
D.The answer is impossible to determine from the information given.
Definitions:
Price Decreases
Reductions in the cost of goods or services, often leading to increased demand.
Normal Goods
Goods for which demand increases as the income of individuals increases, indicating a positive relationship between income and demand.
Equilibrium Price
This is the price at which the quantity of goods supplied matches the quantity of goods demanded, resulting in market equilibrium.
Demand Curve
A graph depicting the relationship between the price of a good and the quantity demanded by consumers at those prices.
Q11: Best practices suggest that unclaimed personal property
Q11: What is the primary function of OSHA?<br>A)
Q37: A production possibility frontier that is a
Q76: We say that the consumption bundles that
Q83: The models used in economics:<br>A.are usually limited
Q168: Economic models are:<br>A.created and used to duplicate
Q231: Figure: Production Possibilities and Circular-Flow Diagram<br> <img
Q271: The maximum amount of one good a
Q283: Figure: Income and Substitution Effects <img src="https://d2lvgg3v3hfg70.cloudfront.net/TB1063/.jpg"
Q386: Alison is a traveling salesperson who drives