TABLE 2-16
The figure below is the percentage polygon for the amount of calories for a sample of 36 pizzas products where the upper limits of the intervals are: 310, 340, 370, 400 and 430.
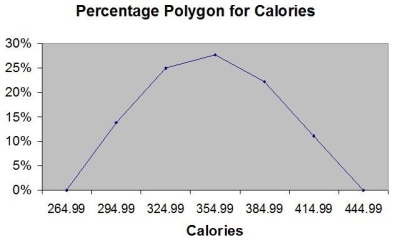
-Referring to Table 2-16, roughly what percentage of pizza products contains between 400 and 430 calories?
Definitions:
Intellectual Skills
Abilities related to thinking, reasoning, problem-solving, and learning.
Qualitative
Pertains to research or data that focuses on descriptions and characteristics that are observed but not measured.
Quantitative
Involving the measurement or assessment of quantities; relating to, measuring, or measured by the quantity of something.
Preoperational
The stage in Piaget's theory of cognitive development, occurring approximately from ages 2 to 7, characterized by the development of language and symbolic thinking but not yet capable of logical problem-solving.
Q4: Referring to Table 4-8, if a randomly
Q20: The amount of calories contained in a
Q31: Referring to Table 3-2, the median carbohydrate
Q33: Bid rigging and customer allocation are what
Q49: The coefficient of variation measures variability in
Q52: Eleven freshmen are to be assigned to
Q56: Referring to Table 4-8, if a randomly
Q99: When constructing a frequency distribution, classes should
Q102: Referring to Table 4-8, if a randomly
Q124: Referring to Table 1-1, the possible responses