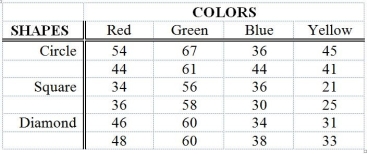
TABLE 11-12
The marketing manager of a company producing a new cereal aimed for children wants to examine the effect of the color and shape of the box's logo on the approval rating of the cereal. He combined 4 colors and 3 shapes to produce a total of 12 designs. Each logo was presented to 2 different groups (a total of 24 groups) and the approval rating for each was recorded and is shown below. The manager analyzed these data using the α = 0.05 level of significance for all inferences.

Analysis of Variance
Source df SS MS F p
Colors 3 2711.17 903.72 72.30 0.000
Shapes 2 579.00 289.50 23.16 0.000
Interaction 6 150.33 25.06 2.00 0.144
Error 12 150.00 12.50
Total 23 3590.50
-Referring to Table 11-12, the mean square for error is ________.
Definitions:
Annual Earnings Ratio
The comparison of earnings over a year often used to analyze profitability or compare salaries.
Average Variable Cost
The total variable cost divided by the number of units produced, showing the variable cost per unit of output.
Average Total Cost
The expense for each unit produced, derived by dividing the total production expenses by the quantity of output.
Total Fixed Cost
The sum of the costs that do not vary with output. They will be incurred as long as a firm continues in business and the assets have alternative uses.
Q12: Referring to Table 12-6, what is the
Q51: Referring to Table 11-6, what is the
Q60: An agronomist wants to compare the crop
Q64: Referring to Table 10-10, what is/are the
Q77: The test for the equality of two
Q84: Referring to Table 9-2, what is the
Q97: Referring to Table 13-4, the managers of
Q185: Referring to Table 13-13, the conclusion on
Q187: Referring to Table 12-17, the rank given
Q229: Referring to Table 14-4, what is the