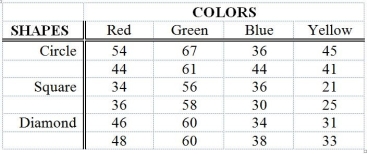
TABLE 11-12
The marketing manager of a company producing a new cereal aimed for children wants to examine the effect of the color and shape of the box's logo on the approval rating of the cereal. He combined 4 colors and 3 shapes to produce a total of 12 designs. Each logo was presented to 2 different groups (a total of 24 groups) and the approval rating for each was recorded and is shown below. The manager analyzed these data using the α = 0.05 level of significance for all inferences.

Analysis of Variance
Source df SS MS F p
Colors 3 2711.17 903.72 72.30 0.000
Shapes 2 579.00 289.50 23.16 0.000
Interaction 6 150.33 25.06 2.00 0.144
Error 12 150.00 12.50
Total 23 3590.50
-Referring to Table 11-12, the value of the statistic used to test for significant differences between colors is ________.
Definitions:
Economic Profit
A measure of performance that includes both the tangible and intangible costs associated with doing business, providing a more comprehensive view than traditional profit metrics.
Restaurant Market
Refers to the commercial space or sector dedicated to establishments offering food and beverage services to customers.
Gas Stations
Gas Stations are retail facilities that sell fuel and engine lubricants for motor vehicles, often offering additional services or goods.
Long Run
A period in which all factors of production and costs are variable, allowing for adjustment in all inputs and production levels.
Q13: Referring to Table 12-7, the expected cell
Q40: Referring to Table 10-5, the p-value of
Q51: Referring to Table 11-6, what is the
Q69: Referring to Table 10-3, suppose α =
Q97: Referring to Table 13-4, the managers of
Q102: Moving companies are required by the
Q166: The squared difference between the observed and
Q180: Referring to Table 14-4, one individual in
Q182: Referring to Table 10-13, suppose α =
Q274: Referring to Table 14-3, the p-value for