TABLE 12-18
Two new different models of compact SUVs have just arrived at the market. You are interested in comparing the gas mileage performance of both models to see if they are the same. A partial computer output for twelve compact SUVs of model 1 and thirteen of model 2 is given below:
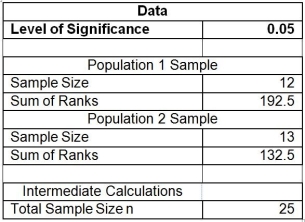
You are told that the gas mileage population distributions for both models are not normally distributed.
-Referring to Table 12-18, what is your decision on the test using a 5% level of significance?
Definitions:
Multiple Determination
A statistical measure represented as R^2, indicating the proportion of variance in the dependent variable that can be predicted from the independent variables.
Regression Hyperplane
In multivariate statistics, it's a flat subspace that best fits the data points in a regression analysis.
Total Variation
The overall measure of variability or spread in a dataset.
Predictor Variables
Variables that are used in statistical models to predict or explain changes in the dependent variable.
Q22: Referring to Table 12-5, there is sufficient
Q23: If you wish to determine whether there
Q24: Referring to Table 12-13, which of the
Q42: Referring to Table 12-6, what are the
Q81: Referring to 14-16, what is the correct
Q115: Referring to Table 14-6, what is the
Q141: Referring to Table 14-13, the predicted demand
Q291: Referring to 14-16, there is enough evidence
Q328: Referring to Table 14-17 Model 1, which
Q330: Referring to Table 14-15, which of the