TABLE 13-2
A candy bar manufacturer is interested in trying to estimate how sales are influenced by the price of their product. To do this, the company randomly chooses 6 small cities and offers the candy bar at different prices. Using candy bar sales as the dependent variable, the company will conduct a simple linear regression on the data below: 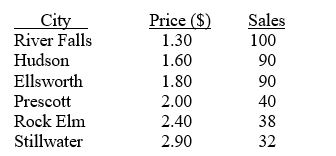
-Referring to Table 13-2, what is the estimated slope for the candy bar price and sales data?
Definitions:
Q43: Referring to Table 14-7, the department head
Q56: Referring to Table 13-2, what is the
Q84: Referring to Table 11-11, what degrees of
Q100: A local real estate appraiser analyzed the
Q108: Referring to Table 12-7, the test will
Q122: Referring to Table 10-10, construct a 95%
Q140: Referring to Table 11-7, the among-group variation
Q162: Referring to Table 13-11, the Durbin-Watson statistic
Q183: Referring to Table 13-10, generate the scatter
Q191: When an explanatory variable is dropped from