TABLE 14-5
A microeconomist wants to determine how corporate sales are influenced by capital and wage spending by companies. She proceeds to randomly select 26 large corporations and record information in millions of dollars. The Microsoft Excel output below shows results of this multiple regression. 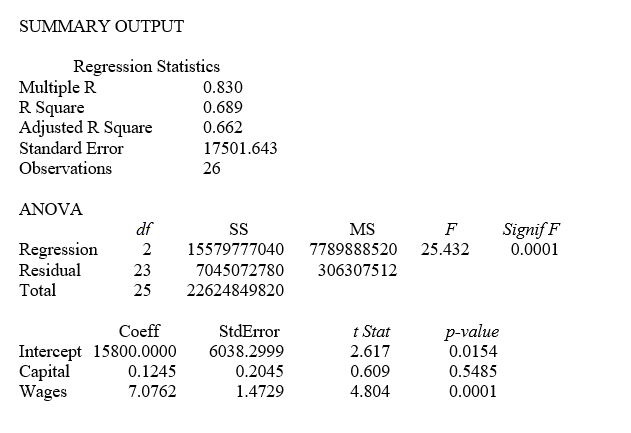
-Referring to Table 14-5, when the microeconomist used a simple linear regression model with sales as the dependent variable and wages as the independent variable, she obtained an r² value of 0.601. What additional percentage of the total variation of sales has been explained by including capital spending in the multiple regression?
Definitions:
Net Income
The total profit of a company after all expenses, taxes, and costs have been subtracted from total revenue; also known as the bottom line.
Income and Losses
Represents the financial performance of a business, where income refers to the earnings and losses indicate the expenses exceeding earnings over a period.
Original Investments
The initial amount of money put into purchasing assets or starting a venture, setting the foundation for future growth or income.
Net Income
The total profit or loss a company, generates after all expenses, taxes, and costs have been deducted from total revenue.
Q4: Referring to Table 13-7, which of the
Q7: Referring to Table 14-19, what should be
Q36: Collinearity is present when there is a
Q37: A trend is a persistent pattern in
Q41: Referring to Table 12-5, what is the
Q82: Referring to Table 13-13, the degrees of
Q92: Referring to Table 15-6, the variable X?
Q117: Referring to Table 14-15, the null hypothesis
Q196: Referring to Table 12-11, the same decision
Q261: Referring to Table 14-13, the predicted demand