TABLE 14-5
A microeconomist wants to determine how corporate sales are influenced by capital and wage spending by companies. She proceeds to randomly select 26 large corporations and record information in millions of dollars. The Microsoft Excel output below shows results of this multiple regression. 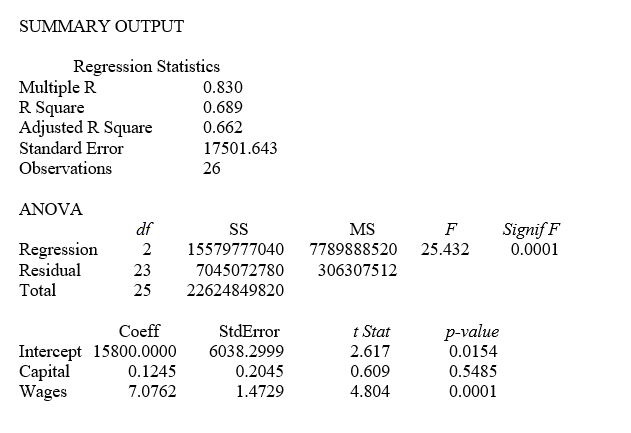
-Referring to Table 14-5, what is the p-value for Wages?
Definitions:
Total Market Value
The aggregate valuation of a company or asset in the marketplace, calculated by multiplying price by quantity of shares.
Improved Liquidity
Refers to an increase in the ease with which assets can be converted into cash without a significant loss in value.
Stock's Expected Price
An estimate of the future price of a stock based on earnings forecasts, market trends, and other factors.
Target Capital Structure
The optimal mix of debt, equity, and other sources of financing that a company aims to achieve for minimizing cost of capital and maximizing value.
Q24: Referring to Table 11-12, the mean square
Q47: Referring to Table 15-4, the residual plot
Q70: Referring to Table 12-6, there is sufficient
Q75: Referring to Table 12-10, what is the
Q79: Referring to Table 14-7, the department head
Q83: Referring to Table 16-8, the forecast for
Q125: Referring to Table 16-1, set up a
Q159: Referring to Table 14-8, the estimate of
Q186: Referring to Table 13-4, the coefficient of
Q335: Referring to Table 14-15, you can conclude