TABLE 14-11
A weight-loss clinic wants to use regression analysis to build a model for weight-loss of a client (measured in pounds) . Two variables thought to affect weight-loss are client's length of time on the weight-loss program and time of session. These variables are described below:
Y = Weight-loss (in pounds)
X₁ = Length of time in weight-loss program (in months)
X₂ = 1 if morning session, 0 if not
X₃ = 1 if afternoon session, 0 if not (Base level = evening session)
Data for 12 clients on a weight-loss program at the clinic were collected and used to fit the interaction model:
Y = β₀ + β₁X₁ + β₂X₂ + β₃X₃ + β₄X₁X₂ + β₅X₁X₂ + ε
Partial output from Microsoft Excel follows:
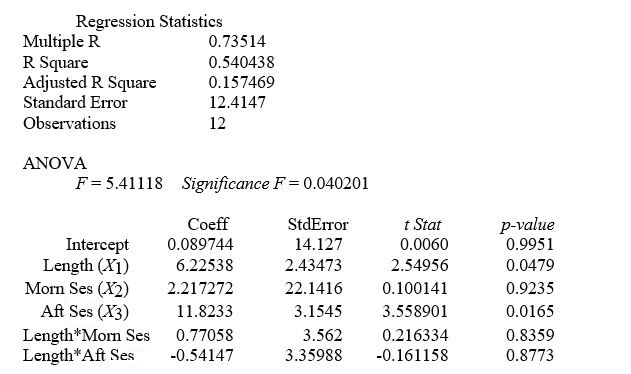
-Referring to Table 14-11, in terms of the βs in the model, give the mean change in weight-loss (Y) for every 1 month increase in time in the program (X₁) when attending the morning session.
Definitions:
Q4: Referring to Table 12-18, what is the
Q6: Referring to Table 12-10, what is the
Q47: Referring to Table 15-4, the residual plot
Q100: Referring to Table 13-8, the value of
Q102: The McNemar test is approximately distributed as
Q127: Referring to Table 14-17 and using both
Q187: Referring to Table 14-15, which of the
Q237: Referring to 14-16, what is the correct
Q290: In a particular model, the sum of
Q323: Referring to Table 14-19, there is not