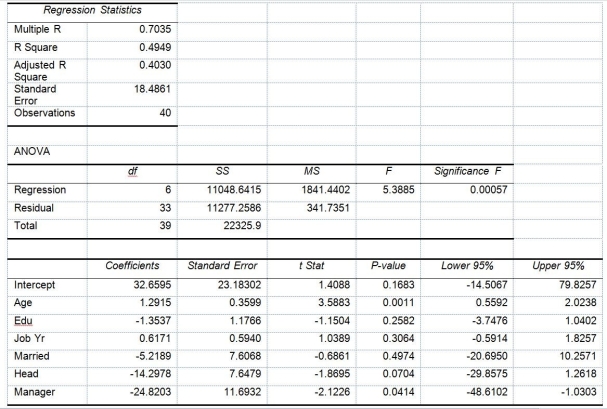
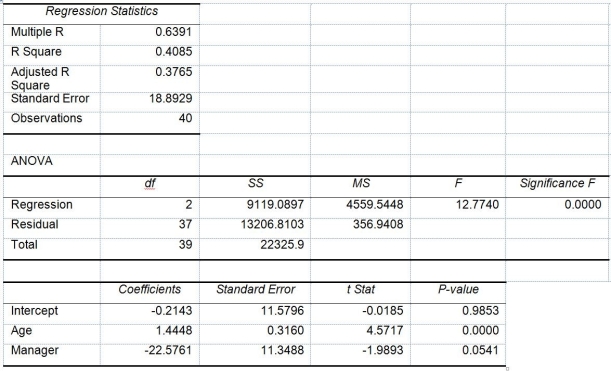
TABLE 14-17


Model 2 is the regression analysis where the dependent variable is Unemploy and the independent variables are
Age and Manager. The results of the regression analysis are given below:

-Referring to Table 14-17 Model 1, the null hypothesis should be rejected at a 10% level of significance when testing whether age has any effect on the number of weeks a worker is unemployed due to a layoff.
Definitions:
Demand Curves
Graphical representations showing the relationship between the price of a good or service and the quantity demanded for a given period.
Supply Curves
Graphical representations that show the relationship between the price of a good and the quantity of the good that suppliers are willing to sell.
Above Equilibrium
Above Equilibrium describes a condition where the price of a good or service is higher than the equilibrium price, leading to a surplus of supply over demand.
Quantity Demanded
It is the specific amount of goods or services that consumers are willing and able to purchase at a given price point, at a specific time.
Q8: Referring to Table 14-17 Model 1, which
Q16: Referring to Table 17-9, estimate the percentage
Q29: Referring to Table 15-6, what is the
Q82: The stepwise regression approach takes into consideration
Q89: Referring to table 13-11, which of the
Q115: Referring to Table 13-9, the degrees of
Q130: The sample correlation coefficient between X and
Q142: Referring to Table 13-4, the managers of
Q156: Referring to Table 13-12, what are the
Q167: Referring to Table 16-12, the best interpretation