TABLE 15-1
A certain type of rare gem serves as a status symbol for many of its owners. In theory, for low prices, the demand increases and it decreases as the price of the gem increases. However, experts hypothesize that when the gem is valued at very high prices, the demand increases with price due to the status owners believe they gain in obtaining the gem. Thus, the model proposed to best explain the demand for the gem by its price is the quadratic model:
Y = β₀ + β₁X + β₁X² + ε
where Y = demand (in thousands) and X = retail price per carat.
This model was fit to data collected for a sample of 12 rare gems of this type. A portion of the computer analysis obtained from Microsoft Excel is shown below: 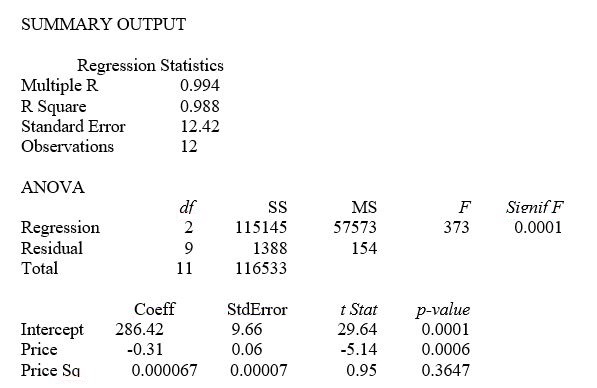
-Referring to Table 15-1, what is the p-value associated with the test statistic for testing whether there is an upward curvature in the response curve relating the demand (Y) and the price (X) ?
Definitions:
Ceteris Paribus
A Latin phrase meaning "all other things being equal," used in economics to isolate the effect of one variable change in a model.
Demand Decreases
A situation where the quantity of a good or service desired by consumers lessens.
Demand Curve
A graph showing the relationship between the price of a good and the amount of the good that consumers are willing and able to buy at each price.
Inferior Good
A type of good for which demand decreases as the income of the consumer increases.
Q29: Referring to Table 14-17 Model 1, we
Q41: Referring to Table 17-7, an R chart
Q43: Data on the amount of time spent
Q56: Referring to Table 14-12, what is the
Q132: Referring to Table 13-11, the null hypothesis
Q132: Referring to Table 14-18, which of the
Q178: The confidence interval for the mean of
Q192: Referring to Table 13-11, which of the
Q199: Referring to Table 14-15, you can conclude
Q275: Referring to Table 14-17 Model 1, _