Multiple Choice
Below is a frequency table showing the number of new restaurants opened in the city over the past 24 months.Compute the variance of the number of openings data.Treat the data as a population. 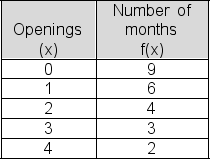
Definitions:
Related Questions
Q7: In a multi-stage experiment, if there are
Q10: Prior to the Watson v.Ft.Worth Bank &
Q20: Conventional wisdom holds that interviewers make an
Q37: Once bands have been created, which of
Q38: Why did the growing use of ability
Q39: For a binomial distribution, find P(x =
Q43: The relative frequency table below shows the
Q58: Estimates of the amount of theft in
Q128: You have an important test tomorrow morning
Q129: The joint probability of A and B