Use the graph to answer the following question.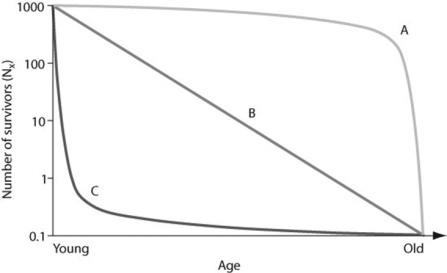
Which of the following examples are plausible explanations for a population that would produce curve A in the figure?
I.Ongoing predation of rabbits throughout their lives
II.Susceptibility of older humans to heart disease
III.High seedling mortality in sunflowers
Definitions:
Q6: In correct chronological order, the three phases
Q16: Which of the following statements is most
Q28: How does a sales rep most likely
Q42: Practicing an approach before making initial contact
Q48: When climbing a mountain, we can observe
Q50: Use the following figure to answer the
Q64: The embryonic precursor to the human spinal
Q65: Acid precipitation lowered the pH of soil
Q70: Approximately how many kilograms (kg)of carnivore (secondary
Q75: Knowledge workers need selling skills to communicate