Use the data given below to answer the following question(s).
Following is the purchase order database of 'The Chef Says So', a restaurant in New York, over the last quarter (April-June).
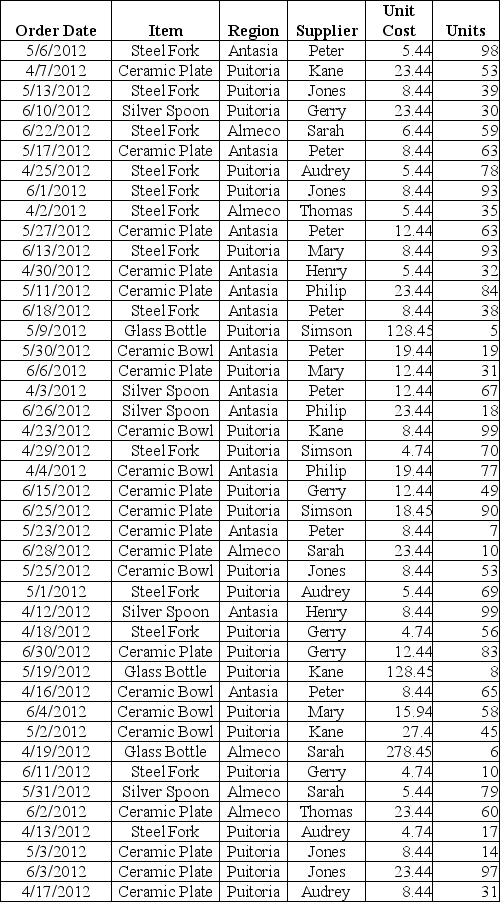
-Describe and construct a cross-tabulation showing the region-wise percentage breakdown of purchase of glass bottles and silver spoons and visually represent the data in a 3-D cylindrical chart.
Counts:
Percentages by Region:
Definitions:
Q2: What is the value of mean absolute
Q16: A cyclical effect is one that repeats
Q19: Which of the following tests is used
Q24: Which of the following motives would most
Q27: What is the relative frequency of Female
Q29: A value proposition is best defined as
Q30: Gavin's position at Pharma-Tech involves purchasing complex
Q47: For a simple linear regression model, significance
Q49: Which combination of communication styles between salesperson
Q65: The person who withdraws money from a