TABLE 9-1
Microsoft Excel was used on a set of data involving the number of defective items found in a random sample of 46 cases of light bulbs produced during a morning shift at a plant. A manager wants to know if the mean number of defective bulbs per case is greater than 20 during the morning shift. She will make her decision using a test with a level of significance of 0.10. The following information was extracted from the Microsoft Excel output for the sample of 46 cases:
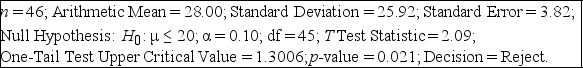
-Referring to Table 9-1, the null hypothesis would be rejected if a 5% probability of committing a Type I error is allowed.
Definitions:
Q25: A random sample of 50 provides a
Q33: Referring to Table 7-5, what proportion of
Q46: A sample is used to obtain a
Q87: Referring to Table 9-7, the company officials
Q88: Referring to Table 6-2, for a given
Q100: A _ is a numerical quantity computed
Q163: Referring to Table 10-19, the decision made
Q167: As the size of the sample is
Q208: Referring to Table 10-3, suppose α =
Q214: Referring to Table 10-20, what is the