TABLE 10-17
A realtor wants to compare the mean sales-to-appraisal ratios of residential properties sold in four neighborhoods (A, B, C, and D) . Four properties are randomly selected from each neighborhood and the ratios recorded for each, as shown below.
A: 1.2, 1.1, 0.9, 0.4 C: 1.0, 1.5, 1.1, 1.3
B: 2.5, 2.1, 1.9, 1.6 D: 0.8, 1.3, 1.1, 0.7
Interpret the results of the analysis summarized in the following table:
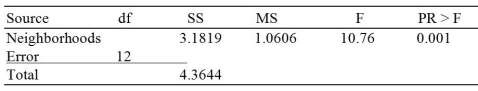
-Referring to Table 10-17, the among group degrees of freedom is
Definitions:
Educates Customers
Providing information or guidance to consumers to help them make informed decisions about products or services.
Restrictive Covenants
Provisions in contracts that limit the actions or behaviors of parties, often used to protect business interests and maintain competitive advantage.
Misrepresentation
The act of giving a false or misleading account of the nature of something.
Relationship Marketing
A strategy designed to foster customer loyalty, interaction, and long-term engagement rather than focusing solely on immediate sales.
Q8: Referring to Table 13-3, what is the
Q12: The sample correlation coefficient between X and
Q13: Referring to Table 13-7, the estimate of
Q19: Referring to Table 12-10, the mean weekly
Q35: Referring to Table 8-6, 95% of the
Q82: Referring to Table 8-9, the superintendent can
Q96: Referring to Table 8-11, the critical value
Q138: Referring to Table 10-9, construct a 99%
Q212: When you test for differences between the
Q269: Referring to Table 10-5, the calculated value