Examlex

Solved

TABLE 13-17 Given Below Are Results from the Regression Analysis Where the Where

question 1

Multiple Choice

TABLE 13-17
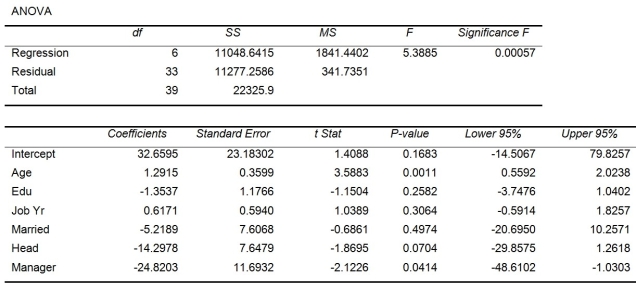
Given below are results from the regression analysis where the dependent variable is the number of weeks a worker is unemployed due to a layoff (Unemploy) and the independent variables are the age of the worker (Age) , the number of years of education received (Edu) , the number of years at the previous job (Job Yr) , a dummy variable for marital status (Married: 1 = married, 0 = otherwise) , a dummy variable for head of household (Head: 1 = yes, 0 = no) and a dummy variable for management position (Manager: 1 = yes, 0 = no) . We shall call this Model 1.
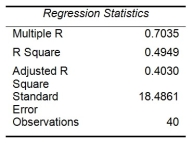
TABLE 13-17 Given below are results from the regression analysis where the dependent variable is the number of weeks a worker is unemployed due to a layoff (Unemploy)  and the independent variables are the age of the worker (Age) , the number of years of education received (Edu) , the number of years at the previous job (Job Yr) , a dummy variable for marital status (Married: 1 = married, 0 = otherwise) , a dummy variable for head of household (Head: 1 = yes, 0 = no)  and a dummy variable for management position (Manager: 1 = yes, 0 = no) . We shall call this Model 1.         Model 2 is the regression analysis where the dependent variable is Unemploy and the independent variables are Age and Manager. The results of the regression analysis are given below:        -Referring to Table 13-17 Model 1, which of the following is a correct statement? A)  40.30% of the total variation in the number of weeks a worker is unemployed due to a layoff can be explained by the age of the worker, the number of years of education received, the number of years at the previous job, marital status, whether the worker is the head of household, and whether the worker is a manager. B)  40.30% of the total variation in the number of weeks a worker is unemployed due to a layoff can be explained by the age of the worker, the number of years of education received, the number of years at the previous job, marital status, whether the worker is the head of household, and whether the worker is a manager, after adjusting for the number of predictors and sample size. C)  40.30% of the total variation in the number of weeks a worker is unemployed due to a layoff can be explained by the age of the worker, the number of years of education received, the number of years at the previous job, marital status, whether the worker is the head of household, and whether the worker is a manager, after adjusting for the level of significance D)  40.30% of the total variation in the number of weeks a worker is unemployed due to a layoff can be explained by the age of the worker, the number of years of education received, the number of years at the previous job, marital status, whether the worker is the head of household, and whether the worker is a manager, holding constant the effect of all the independent variables.
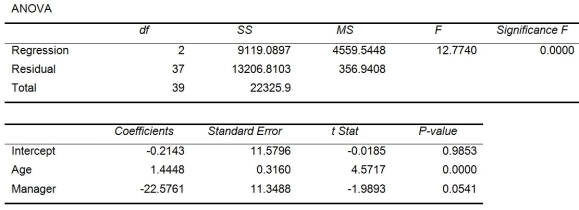
Model 2 is the regression analysis where the dependent variable is Unemploy and the independent variables are Age and Manager. The results of the regression analysis are given below:
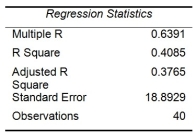
TABLE 13-17 Given below are results from the regression analysis where the dependent variable is the number of weeks a worker is unemployed due to a layoff (Unemploy)  and the independent variables are the age of the worker (Age) , the number of years of education received (Edu) , the number of years at the previous job (Job Yr) , a dummy variable for marital status (Married: 1 = married, 0 = otherwise) , a dummy variable for head of household (Head: 1 = yes, 0 = no)  and a dummy variable for management position (Manager: 1 = yes, 0 = no) . We shall call this Model 1.         Model 2 is the regression analysis where the dependent variable is Unemploy and the independent variables are Age and Manager. The results of the regression analysis are given below:        -Referring to Table 13-17 Model 1, which of the following is a correct statement? A)  40.30% of the total variation in the number of weeks a worker is unemployed due to a layoff can be explained by the age of the worker, the number of years of education received, the number of years at the previous job, marital status, whether the worker is the head of household, and whether the worker is a manager. B)  40.30% of the total variation in the number of weeks a worker is unemployed due to a layoff can be explained by the age of the worker, the number of years of education received, the number of years at the previous job, marital status, whether the worker is the head of household, and whether the worker is a manager, after adjusting for the number of predictors and sample size. C)  40.30% of the total variation in the number of weeks a worker is unemployed due to a layoff can be explained by the age of the worker, the number of years of education received, the number of years at the previous job, marital status, whether the worker is the head of household, and whether the worker is a manager, after adjusting for the level of significance D)  40.30% of the total variation in the number of weeks a worker is unemployed due to a layoff can be explained by the age of the worker, the number of years of education received, the number of years at the previous job, marital status, whether the worker is the head of household, and whether the worker is a manager, holding constant the effect of all the independent variables.
-Referring to Table 13-17 Model 1, which of the following is a correct statement?


Definitions:

Home-Country Nationals

Employees who are citizens of the country where the multinational company is headquartered, often working internationally in its foreign offices or branches.

International Human Resources Management

The process of managing people across international boundaries, including recruitment, deployment, and development of global employees.

Internal Fit

The alignment between an organization's strategies, structures, and processes with its human resources policies and practices.

Workforce Diversity

The inclusion of a wide range of people in a workplace, reflecting differences in race, gender, age, culture, and other characteristics.

Related Questions