TABLE 14-8
Recently, a university switched to a new type of computer-based registration. The registrar is concerned with the amount of time students are spending on the computer registering under the new system. She decides to randomly select 8 students on each of the 12 days of the registration and determine the time each spends on the computer registering. The range, mean, and standard deviation of the times required to register are in the table that follows. 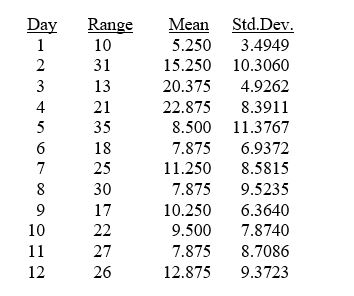
-Referring to Table 14-8, an R chart is to be constructed for the time required to register. One way to create the lower control limit involves multiplying the mean of the sample ranges by D₃. For this data set, the value of D₃ is ________.
Definitions:
Hearing
The physiological process by which sound waves are translated into electrical signals that the brain interprets as sound.
Decibels
A unit of measurement for the intensity of sound, representing the ratio between two quantities and often used to describe noise levels.
Air Pressure Waves
Variations in the pressure of air that are primarily responsible for the propagation of sound.
Neural Messages
Electrical and chemical signals transmitted by neurons to communicate information throughout the body and brain.
Q6: Ryanair uses one type of aircraft in
Q6: The R chart is a control chart
Q8: Referring to Table 13-3, what is the
Q23: Profit sharing plans and employee stock option
Q25: _ profit sharing plans place cash awards
Q28: _ skills refer to similar skills or
Q66: The Durbin-Watson D statistic is used to
Q72: Variation due to the inherent variability in
Q144: Referring to Table 12-13, the p-value of
Q204: Referring to Table 13-5, the observed value