Graph 13-6 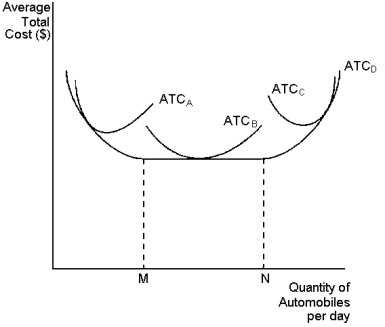 This graph depicts average total cost functions for a firm that produces automobiles.Use the graph to answer the following question(s) .
-Refer to Graph 13-6.At levels of output below point M, the firm experiences:
Definitions:
Equity Financed
Refers to the method of raising capital by selling company shares to investors.
Market Price
The current value at which an asset or service may be traded in a public market.
Total Wealth
The sum of all financial assets and physical possessions that have a monetary value owned by an individual or organization.
Reverse Stock Split
A corporate action that reduces the number of a company's outstanding shares by combining them into fewer, proportionally more valuable shares.
Q52: When developing a new technology for operating
Q58: Technology spillover occurs when:<br>A)the firm's innovations allow
Q62: Resources devoted to complying with the tax
Q70: Historically speaking, when a city builds more
Q76: Refer to Graph 10-1.Which price and quantity
Q79: Sheep-grazing on a common land and wireless
Q84: Average variable cost is equal to the
Q123: Suppose fish stocks in a lake are
Q138: Economists normally assume that the goal of
Q185: In the long run, when price is