The figure given below depicts the demand and supply of Brazilian reals in the foreign exchange market. Assume that the market operates under a flexible exchange rate regime.
Figure 21.1
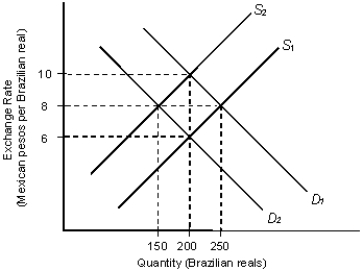
In the figure:
D1 and D2: Demand for Brazilian reals
S1 and S2: Supply of Brazilian reals
-Refer to Figure 21.1. The supply curves shown for Brazilian reals are based on:
Definitions:
Hammond Postulate
A principle stating that the transition state of a chemical reaction resembles the structure of the closest stable species: the reactants for endothermic steps and the products for exothermic steps.
Free Radical Chlorine
A highly reactive species of chlorine that carries an unpaired electron, often involved in radical reactions.
Methane
A simple hydrocarbon with the formula CH4, representing the simplest alkane and a primary component of natural gas.
Regiochemistry
The study of the principles guiding the direction or position that new bonds form in a molecule during a chemical reaction.
Q16: Protecting infant industries from foreign competition may
Q28: _ is defined as the adoption of
Q31: Refer to Figure 18.1. What would happen
Q49: The difference between absolute and comparative advantage
Q64: One of the early characteristics or rationale
Q67: _ is the argument that with globalization,
Q71: Developing countries often justify imposition of tariffs
Q73: What is tolerance for ambiguity? Why is
Q73: Assume that a country's government influences the
Q90: Suppose a U.S. investor buys a Canadian