The figure given below represents the new classical long run and short run Phillips curve measuring inflation rate on vertical axis and unemployment rate on horizontal axis.
Figure 15.2
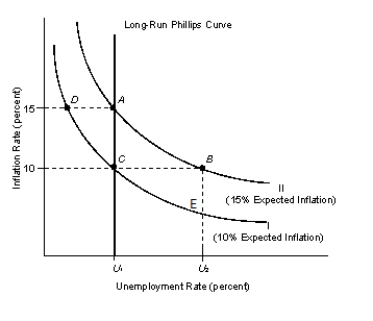
-Refer to Figure 15.2. Assume that the government adopted an unexpected expansionary monetary policy that has the economy currently at point D. If people expect that this inflation rate will persist next year, the economy will now:
Definitions:
Albert Ellis
An American psychologist who developed Rational Emotive Behavior Therapy (REBT), a form of cognitive-behavioral therapy emphasizing the role of beliefs and attitudes in emotional distress.
Term Paper
A research paper written by students over an academic term, representing a large portion of a grade.
Cybertherapist
A professional who provides psychological support and counseling through digital platforms, including video calls, messaging, or online programs.
Cognitive-behavioral Therapy
A psychotherapeutic approach that addresses dysfunctional emotions, behaviors, and cognitions through a goal-oriented, systematic procedure.
Q15: In the United States, the reserve requirement
Q27: According to Table 20.4, the limits to
Q33: The international equilibrium price is the point
Q40: A U.S. federal budget deficit that raises
Q49: Hyperinflation in developing countries is typically the
Q55: Refer to Figure 20.2. The no-trade equilibrium
Q75: Supporters of globalization argue that increased globalization
Q76: What is measured by the ratio of
Q80: Refer to Figure 18.1. Assume that there
Q125: Suppose Fed's purchase of government bonds results