The figure given below represents the leakages and injections in an economy.
Figure 10.3
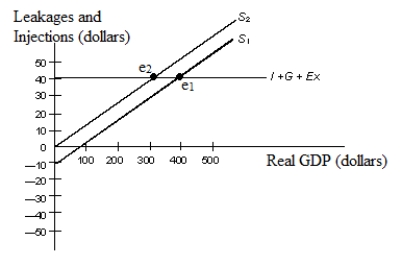 In the figure:
S1 and S2: Saving functions
I: Investment
G: Government spending
EX: Net exports
-In Figure 10.3, which of the following represents the paradox of thrift?
Definitions:
Progressive
Pertaining to a form of taxation in which the tax rate increases as the taxable amount increases, typically applied to income tax.
Regressive
A term describing a tax system where the tax rate decreases as the taxable amount increases, imposing a greater burden on lower-income earners.
Federal Taxes
Taxes levied by the federal government on income, investments, and goods and services, which fund national programs and services.
State And Local Taxes
Taxes levied by individual states and localities, which can include income, sales, property, and other types of taxes.
Q11: A rightward shift in the aggregate supply
Q17: A progressive tax system is one in
Q22: Which of the following is assumed to
Q33: Calculate the marginal propensity to save for
Q34: The cash reserves held by banks that
Q44: Total reserve holdings over and above required
Q45: Refer to Table 12.2. With a reserve
Q54: Refer to Table 9.1. When disposable income
Q55: Business inventories tend to fall after an
Q128: The Fed controls the money supply to