Use the REGRESSION feature on a graphing calculator.
-A study was conducted to compare the average time spent in the lab each week versus course grade for computer students. The results are recorded in the table below. 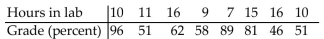 Use linear regression to find a linear function that predicts a student's course grade as a function of the number of hours
Spent in lab.
Definitions:
Independent Variables
Factors in a study or simulation that are adjusted or classified to assess their impact on outcome measures.
Significance Level
A threshold within which the results of a statistical test are deemed statistically significant, often denoted as alpha (α), with common values like 0.05 or 0.01.
Critical Value
A location within the test distribution measured against the test statistic to determine the rejection of the null hypothesis.
Regression Slope Coefficient
A measure in regression analysis that quantifies the change in the dependent variable for a one unit change in an independent variable.
Q5: f(x) satisfies <img src="https://d2lvgg3v3hfg70.cloudfront.net/TB8593/.jpg" alt="f(x) satisfies
Q9: <img src="https://d2lvgg3v3hfg70.cloudfront.net/TB8593/.jpg" alt=" A)
Q10: Henry Smith buys a $60,000 T-bill at
Q16: Universal Gallery earned $400 interest in 90
Q17: Net cost $1,523; trade discount <img src="https://d2lvgg3v3hfg70.cloudfront.net/TB8285/.jpg"
Q21: Find <img src="https://d2lvgg3v3hfg70.cloudfront.net/TB8593/.jpg" alt="Find A)
Q28: <img src="https://d2lvgg3v3hfg70.cloudfront.net/TB8593/.jpg" alt=" between x =
Q31: Erika Du Mesnil has gross earnings of
Q50: <img src="https://d2lvgg3v3hfg70.cloudfront.net/TB8285/.jpg" alt=" A)Turnover at cost
Q103: Westinghouse Paving pays its salespeople the following