SCENARIO 14-17 Given below are results from the regression analysis where the dependent variable is the number of weeks a worker is unemployed due to a layoff (Unemploy)and the independent variables are the age of the worker (Age)and a dummy variable for management position (Manager: 1 = yes, 0 = no). The results of the regression analysis are given below: 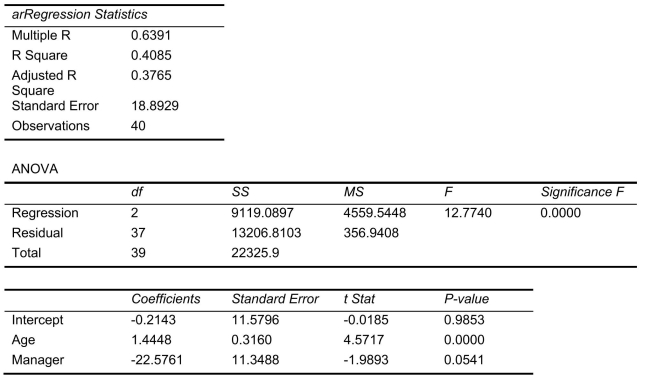
-Referring to Scenario 14-17, we can conclude definitively that, holding constant the effect of the other independent variable, age has an impact on the mean number of weeks a worker is unemployed due to a layoff at a 10% level of significance if all we have is the information of the 95% confidence interval estimate for the effect of a one year increase in age on the mean number of weeks a worker is unemployed due to a layoff.
Definitions:
Income Elasticity
A measure of how much the demand for a good or service changes in response to changes in the consumer's income.
Midpoint Method
A technique used to calculate the percentage change between two values, avoiding the problem of path dependency by using the average of the initial and final values as the base.
Normal Goods
Goods for which demand increases as the income of individuals increases.
Income Elasticity of Demand
A gauge for the sensitivity of demand for an item to shifts in the income levels of buyers.
Q4: Data on the amount of time spent
Q11: Referring to Scenario 13-6, which of the
Q15: Referring to Scenario 15-1, does there appear
Q22: Referring to Scenario 14-15, what is the
Q40: Referring to Scenario 13-13, the critical value
Q74: Referring to Scenario 17-4, the highest mean
Q85: In stepwise regression, an independent variable is
Q87: Referring to Scenario 16-14, to obtain a
Q113: Referring to Scenario 17-2, the Asia Pacific
Q133: Referring to Scenario 13-9, the estimated change