SCENARIO 15-1 A certain type of rare gem serves as a status symbol for many of its owners.In theory, for low prices, the demand increases, and it decreases as the price of the gem increases.However, experts hypothesize that when the gem is valued at very high prices, the demand increases with price due to the status owners believe they gain in obtaining the gem.Thus, the model proposed to best explain the demand for the gem by its price is the quadratic model: 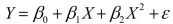 where Y = demand (in thousands) and X = retail price per carat. This model was fit to data collected for a sample of 12 rare gems of this type.A portion of the computer analysis obtained from Microsoft Excel is shown below: SUMMARY OUTPUT
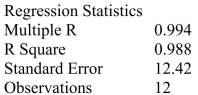
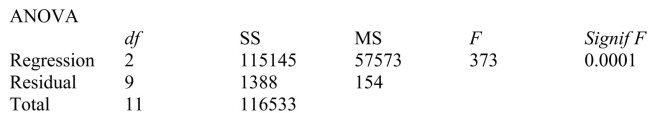
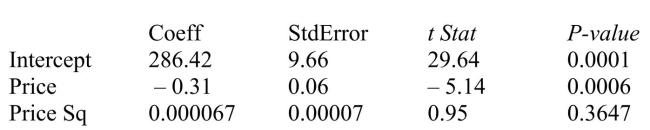
-Referring to Scenario 15-1, what is the value of the test statistic for testing whether there is an upward curvature in the response curve relating the demand (Y) and the price (X) ?
Definitions:
Q6: In real-world business analytics, filtering is typically
Q21: Referring to Scenario 13-9, the p-value of
Q45: Referring to Scenario 16-13, you can conclude
Q72: Some consider bullet graphs little more than
Q105: Referring to Scenario 17-7, what are the
Q143: Referring to Scenario 14-15, which of the
Q151: Referring to Scenario 13-8, what is the
Q155: Referring to Scenario 16-14, in testing the
Q230: Referring to Scenario 14-13, the predicted demand
Q308: Referring to Scenario 14-5, which of the