SCENARIO 15-4 The superintendent of a school district wanted to predict the percentage of students passing a sixth-grade proficiency test.She obtained the data on percentage of students passing the proficiency test (% Passing), daily mean of the percentage of students attending class (% Attendance), mean teacher salary in dollars (Salaries), and instructional spending per pupil in dollars (Spending)of 47 schools in the state. Let Y = % Passing as the dependent variable,  Attendance,
  Salaries and
  Spending. The coefficient of multiple determination (
  )of each of the 3 predictors with all the other remaining predictors are, respectively, 0.0338, 0.4669, and 0.4743. The output from the best-subset regressions is given below:
 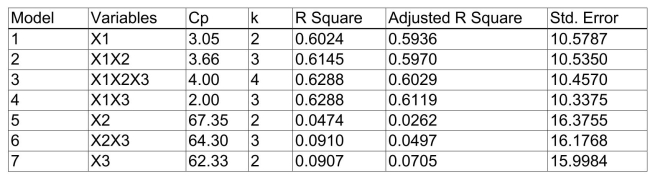 Following is the residual plot for % Attendance:
 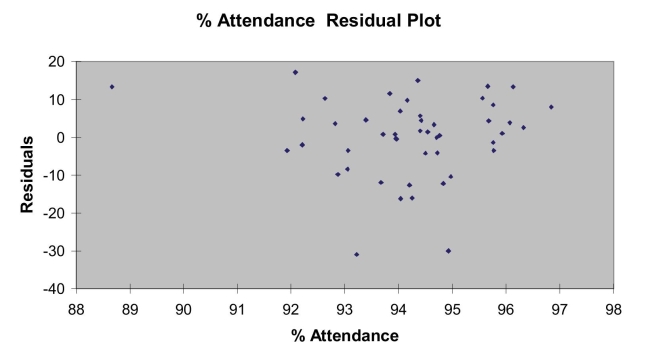 Following is the output of several multiple regression models:
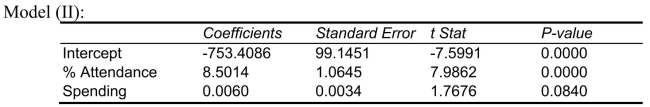
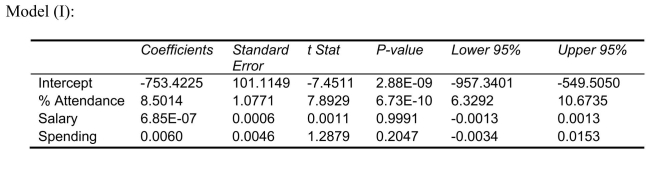
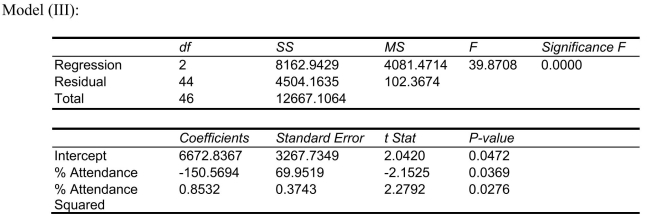
-what is the p-value of the test statistic to determine whether the quadratic effect of daily average of the percentage of students attending class on percentage of students passing the proficiency test is significant at a 5% level of significance?
Definitions:
Workers
Individuals engaged in some form of employment, contributing labor or expertise in exchange for compensation.
Expectancy Theory
A motivational theory suggesting that individuals decide how to behave based on their expectations that the effort will lead to a certain outcome and the value of that outcome to them.
Research Follow-up
The process of collecting additional information or data after an initial investigation to clarify results or answer new questions.
Practical
Focused on or concerned with the actual doing or use of something rather than with theory and ideas.
Q8: Referring to Scenario 14-4, which of the
Q50: Referring to Scenario 14-5, what is the
Q51: Referring to Scenario 16-10, the values of
Q60: Referring to Scenario 14-5, what is the
Q69: The result of the regression tree is
Q83: The <img src="https://d2lvgg3v3hfg70.cloudfront.net/TB8562/.jpg" alt="The statistic
Q101: Referring to Scenario 16-5, the number of
Q144: A first-order autoregressive model for stock sales
Q205: Are Japanese managers more motivated than American
Q285: Referring to Scenario 14-17, we can conclude