SCENARIO 17-3
The tree diagram below shows the results of the classification tree model that has been constructed to predict the probability of a cable company's customers who will switch ("Yes" or "No")into its bundled program offering based on the price ($30,$40,$50,$60)and whether the customer spends more than 5 hours a day watching TV ("Yes" or "No")using the data set of 100 customers collected from a survey.

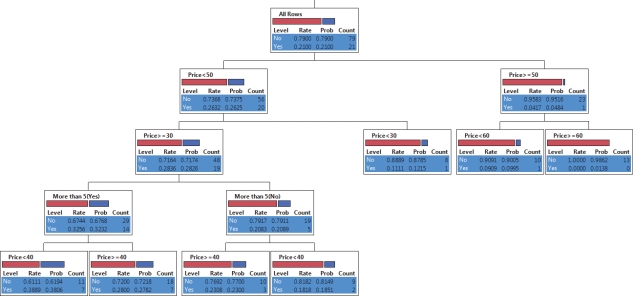
-Referring to Scenario 17-3,the first split occurs at what price?
Definitions:
Cycle Time
is the total time from the beginning to the end of a process, as measured by the customer, that enables a complete understanding of the duration involved in creating a product or service.
Value-Added Efforts
Initiatives or activities that enhance the worth of products, services, or processes, providing additional benefits to customers or stakeholders.
Scrap Rates
The percentage of materials or products that are discarded because they are not up to the required standards or specifications.
Continuous Improvement
A sustained endeavor to refine products, services, or processes through gradual and revolutionary enhancements.
Q7: Referring to Scenario 18-9, what is the
Q52: _ causes of variation are correctable without
Q74: Referring to Scenario 19-5, a p control
Q76: Referring to Scenario 19-4, what is the
Q81: Referring to Scenario 18-10 Model 1, there
Q118: The probability that a particular brand of
Q195: Referring to Scenario 18-5, the estimated mean
Q234: In trying to construct a model to
Q248: Referring to Scenario 18-9, there is enough
Q266: A powerful women's group has claimed that