SCENARIO 18-10 Given below are results from the regression analysis where the dependent variable is the number of weeks a worker is unemployed due to a layoff (Unemploy) and the independent variables are the age of the worker (Age) , the number of years of education received (Edu) , the number of years at the previous job (Job Yr) , a dummy variable for marital status (Married: 1 = married, 0 = otherwise) , a dummy variable for head of household (Head: 1 = yes, 0 = no) and a dummy variable for management position (Manager: 1 = yes, 0 = no) .We shall call this Model 1.The coefficient of partial determination 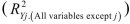 of each of the 6 predictors are, respectively, 0.2807, 0.0386, 0.0317, 0.0141, 0.0958, and 0.1201.
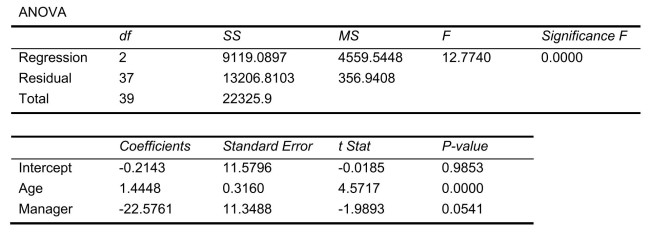
 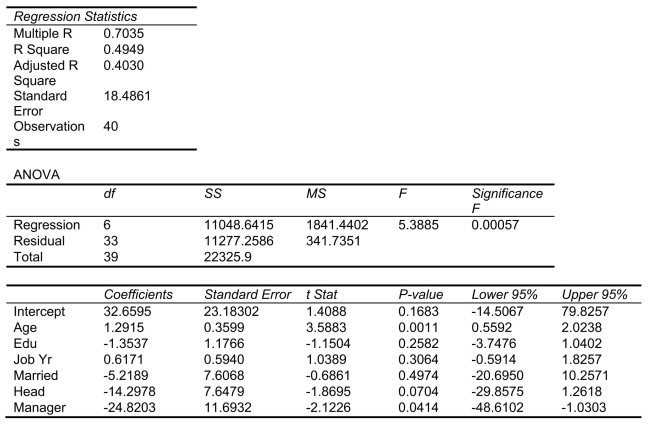 Model 2 is the regression analysis where the dependent variable is Unemploy and the independent variables are Age and Manager.The results of the regression analysis are given below:
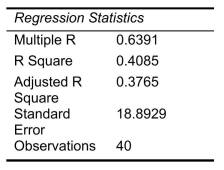
-Referring to Scenario 18-10 Model 1, which of the following is the correct null hypothesis to test whether being married or not makes a difference in the mean number of weeks a worker is unemployed due to a layoff while holding constant the effect of all the other independent variables?
Definitions:
Increase
An upward change or growth in value, quantity, or size.
Demand Curve
A graph showing the relationship between the price of a good and the quantity demanded at those prices, typically downward sloping.
Demand
The quantity of a good or service that consumers are willing and able to purchase at various prices during a specified period.
Shifts
Refers to changes in the position of demand or supply curves in economic models, often due to changes in external factors such as technology, preferences, or policy.
Q31: Referring to Scenario 16-13, if a five-month
Q63: Referring to Scenario 20-6, how many possible
Q68: Referring to Scenario 20-5, what is the
Q69: Referring to Scenario 16-10, the fitted values
Q74: Referring to Scenario 18-8, the null hypothesis
Q96: Referring to Scenario 20-6, what is the
Q127: Referring to Scenario 16-7, the fitted exponential
Q161: Referring to Scenario 19-7, an <img src="https://d2lvgg3v3hfg70.cloudfront.net/TB8562/.jpg"
Q285: Referring to Scenario 18-9, the 0 to
Q327: Referring to Scenario 18-5, to test the