SCENARIO 18-10 Given below are results from the regression analysis where the dependent variable is the number of weeks a worker is unemployed due to a layoff (Unemploy)and the independent variables are the age of the worker (Age), the number of years of education received (Edu), the number of years at the previous job (Job Yr), a dummy variable for marital status (Married: 1 = married, 0 = otherwise), a dummy variable for head of household (Head: 1 = yes, 0 = no)and a dummy variable for management position (Manager: 1 = yes, 0 = no).We shall call this Model 1.The coefficient of partial determination 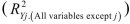 of each of the 6 predictors are, respectively, 0.2807, 0.0386, 0.0317, 0.0141, 0.0958, and 0.1201.
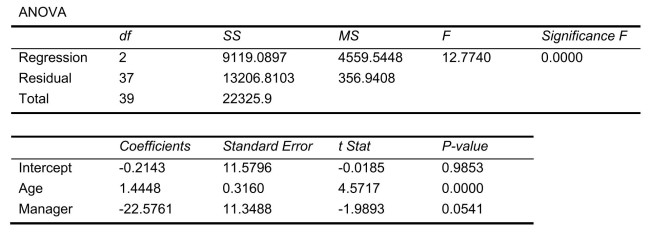
 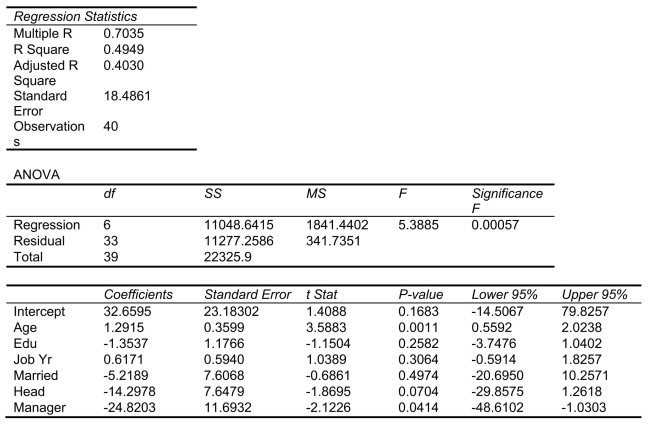 Model 2 is the regression analysis where the dependent variable is Unemploy and the independent variables are Age and Manager.The results of the regression analysis are given below:
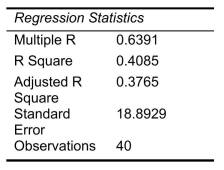
-Referring to Scenario 18-10 Model 1, the null hypothesis should be rejected at a 10% level of significance when testing whether being married or not makes a difference in the mean number of weeks a worker is unemployed due to a layoff while holding constant the effect of all the other independent variables.
Definitions:
Face-to-face
A form of communication where the parties involved interact directly in the same physical space, allowing for non-verbal cues.
A method of exchanging digital messages over the Internet between people using electronic devices.
Primary Research Methods
Techniques used to gather new data directly from sources or experiments, rather than analyzing existing data.
Social Sciences
Academic disciplines that study societies and human behavior, including psychology, sociology, anthropology, and economics.
Q3: Referring to Scenario 20-1, if the probability
Q11: Referring to Scenario 18-6, in terms of
Q41: The SS method establishes ways to eliminate
Q48: Referring to Scenario 16-4, a centered 3-year
Q55: SMED establishes ways to clean and maintain
Q70: Referring to Scenario 18-11, what are the
Q93: Referring to Scenario 19-8, an R chart
Q95: Referring to Scenario 19-6, the estimate of
Q102: Referring to Scenario 18-5, to test the
Q115: Referring to Scenario 18-8, what is the