SCENARIO 19-3
A quality control analyst for a light bulb manufacturer is concerned that the time it takes to produce a batch of light bulbs is too erratic.Accordingly,the analyst randomly surveys 10 production periods each day for 14 days and records the sample mean and range for each day.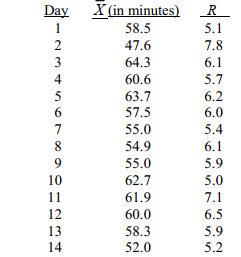
-Referring to Scenario 19-3,suppose the sample mean and range data were based on 11 observations per day instead of 10.How would this change affect the lower and upper control limits of the R chart?
Definitions:
Objective Concept
A notion or idea based on factual and measurable evidence rather than personal feelings or opinions.
Observable Phenomenon
Events or occurrences that can be perceived directly through the senses or with the help of scientific instruments.
Not Scarce
Describes resources that are available in abundance and not limited in supply, in contrast to scarce resources which are limited and can be exhausted.
Q40: Referring to Scenario 20-3, what is the
Q43: In multidimensional scaling, the stress statistic is
Q49: Referring to Scenario 18-10 Model 1, predict
Q51: Referring to Scenario 19-3, suppose the analyst
Q68: Referring to Scenario 20-5, what is the
Q92: Referring to Scenario 20-2, what is the
Q103: Referring to Scenario 17-2, which region has
Q139: The CPL and CPU indexes are used
Q161: Referring to Scenario 19-7, an <img src="https://d2lvgg3v3hfg70.cloudfront.net/TB8562/.jpg"
Q270: Referring to Scenario 18-1, suppose the builder