Exhibit 3A-1 Comparison of Market Efficiency and Deadweight Loss 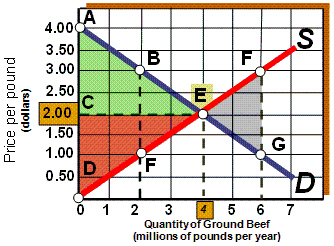 As shown in Exhibit 3A-1, if the market price falls from $3.00 to $2.00, then:
Definitions:
Q26: Exhibit 2-16 Production possibilities curve <img src="https://d2lvgg3v3hfg70.cloudfront.net/TBX9027/.jpg"
Q67: Exhibit 2-11 Production possibilities curves <img src="https://d2lvgg3v3hfg70.cloudfront.net/TBX9027/.jpg"
Q71: An increase in consumers' incomes will have
Q79: An advance in technology results in:<br>A)suppliers offering
Q121: Exhibit 2-13 Production possibilities curve <img src="https://d2lvgg3v3hfg70.cloudfront.net/TBX9027/.jpg"
Q148: On the production possibilities curve, a movement
Q199: Exhibit 4-3 Supply and demand curves <img
Q235: When the market price of a product
Q249: Exhibit 3-15 Supply and demand curves for
Q348: If quantity demanded is greater than quantity