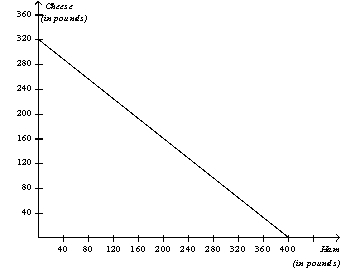
Figure 3-11
The graph below represents the various combinations of ham and cheese (in pounds) that the nation of Bonovia could produce in a given month.

-Refer to Figure 3-11.Whenever Bonovia increases its production of ham by 1 pound per month,then it must decrease its production of cheese by
Definitions:
Competitive Equilibrium
A situation in a market where the demand for goods equals the supply of goods, resulting in an equilibrium price and quantity that clears the market.
Utility Function
A function that captures the level of satisfaction or happiness that consumers derive from consuming various combinations of goods and services.
Initial Allocation
The initial distribution of goods, resources, or entitlements among individuals or groups before any trade or market exchange occurs.
Contract Curve
In economics, it is a curve that shows the set of mutually beneficial (efficient) allocations in a trade or exchange situation.
Q37: Refer to Figure 3-7.If Bintu must work
Q40: In the circular-flow diagram,households and firms are
Q89: A person can benefit from specialization and
Q95: Refer to Figure 3-11.Whenever Bonovia increases its
Q174: If a increase in income decreases the
Q248: Equilibrium price must increase when demand<br>A) increases
Q334: Refer to Table 3-11.Falda has a comparative
Q374: Refer to Table 3-8.Huang has an absolute
Q386: When two variables move in the same
Q529: With the resources it has,an economy can