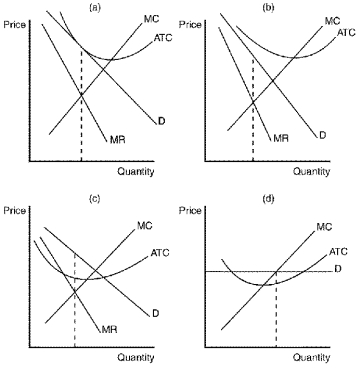
Figure 16-4

-Refer to Figure 16-4.Which of the graphs depicts a short-run equilibrium that will encourage the entry of other firms into a monopolistically competitive industry?
Definitions:
Sales Revenue
The income received by a company from its sales of goods or the provision of services, before any expenses are deducted.
Earnings Before Interest And Taxes
A financial performance measure that calculates a company's profitability before deductions for interest and taxes.
Operating Income
The amount of profit realized from a business's operations after deducting operating expenses such as wages, depreciation, and cost of goods sold.
Operating Leverage
A measure of how revenue growth translates into growth in operating income, indicating the proportion of fixed costs in a company's cost structure.
Q37: Price discrimination explains why Ivy League universities
Q46: Refer to Table 15-13.How much profit will
Q73: Critics of advertising argue that advertising<br>A) creates
Q89: Monopolistic competition is characterized by many buyers
Q100: Monopolistic competition differs from perfect competition because
Q170: A monopolistically competitive market could be considered
Q197: A firm can earn economic profits in
Q203: When consumers are exposed to additional choices
Q227: Among arguments for and against advertising,both sides
Q326: Roberto consumes Coke exclusively.He claims that there