Figure 19-2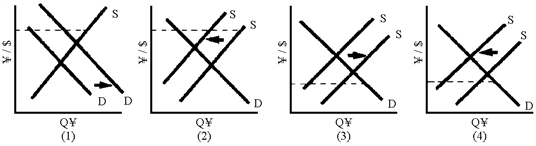
Of the graphs in Figure 19-2, which one shows the effects on the exchange rate of an expansion in Japan?
Definitions:
Cross-Border Merger
A transaction where companies from different countries merge to create a new entity or one absorbs the other, expanding their global footprint and operational reach.
Joint Venture
A business agreement between two or more parties to jointly undertake a specific project or business activity, sharing profits, losses, and control.
Ethnocentrism
The belief in the superiority of one's own cultural group, often accompanied by a disregard for other cultures.
Polycentric Attitude
An approach that recognizes and values the diversity and difference of various cultures and practices in international business.
Q14: Tariffs are more desirable than quotas if
Q55: Protectionism may reduce imports, and it will
Q57: If Japanese tourists visit Yellowstone Park, what
Q65: Is the call for protection on the
Q75: One major reason why the purchasing power
Q91: The Bretton Woods agreements were ended when
Q118: If a nation does not have an
Q146: If a country's productivity doubles for everything
Q180: Assume that a country imposes a tariff
Q208: If a country is in a strong