Multiple Choice
Figure 4-19 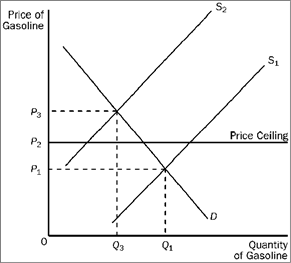 Refer to Figure 4-19. When the price ceiling applies in this market and the supply curve for gasoline shifts from S1 to S2, the resulting quantity of gasoline that is bought and sold is
Definitions:
Related Questions
Q5: Between 1930 and 1980, government expenditures as
Q16: In which of the following situations is
Q26: In the case of a private good,
Q62: Which of the following is most likely
Q79: If a $2 tax per bottle of
Q111: Other things constant, an increase in consumer
Q116: Which of the following is a shortcoming
Q135: Public choice analysis<br>A) assumes individuals in the
Q155: Profits and losses play an important role
Q261: Use the figure below illustrating the impact