The 1994 GSS asked the following question: Do you sometimes drink more than you think you should? The table below breaks down responses to this question by sex.
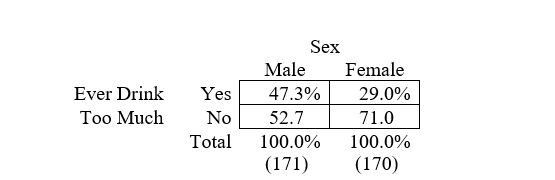 a. What is the percentage difference for determining the association between these variables?
b. Who is more likely to say that they sometimes drink more than they think they should?
c. Chi-square for this table is 12.50, which is significant at p < .001. What does this indicate about the relationship between the variables?
d. The value of phi for this table is .19. What does this statistic tell us about the relationship?
Definitions:
Improvement
A process or action that makes something better, more efficient, or more effective.
Technology
The application of scientific knowledge for practical purposes, especially in industry.
Supply Curve
A graphical representation showing the relationship between the price of a good and the amount of it that sellers are willing to supply.
Quantity Demanded
The complete sum of a particular good or service that customers are prepared and able to buy at a given price level.
Q4: The predicted direction of the relationship between
Q5: A negative correlation between variables means that
Q17: Draw an arrow diagram representing a causal
Q34: Scientific theories provide a sense of understanding
Q35: Residual tension is the level of tension
Q36: What is the best placement in a
Q55: Which type of study is not compatible
Q63: With self-administered questionnaires, anonymity secures participants' right
Q73: The GSS measure of television viewing asks,
Q105: Which of the following are the requirements