Refer to the tables.
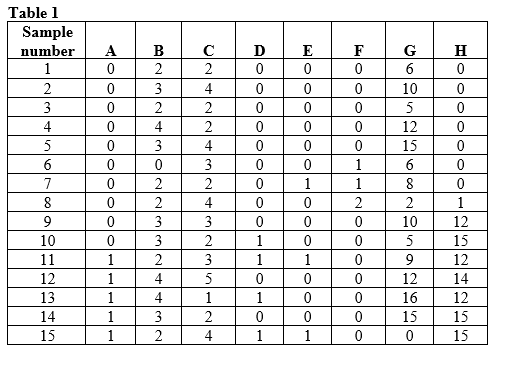
 Suppose you are researching an ecological community in a new study area. You divide your study area into quadrats and sample one quadrat a day to determine the species that occupy the area and how many individuals of these species are present. Assume that by the end of your sampling efforts, you have identified all of the species that occur in the study area. Now suppose that species H is an invasive species and that the samples listed in Table 1 show the presence and abundance of species in the same area across 15 years of study. Examine the patterns and impact of the invasion of species H on this community by answering the following questions:
a) Based on Table 1, in which year did species H invade the community?
b) Based on Table 1, when did populations of species H begin to grow?
c) By the end of your study period (in year 15), how does the proportional abundance of species H compare to that of other species in the community?
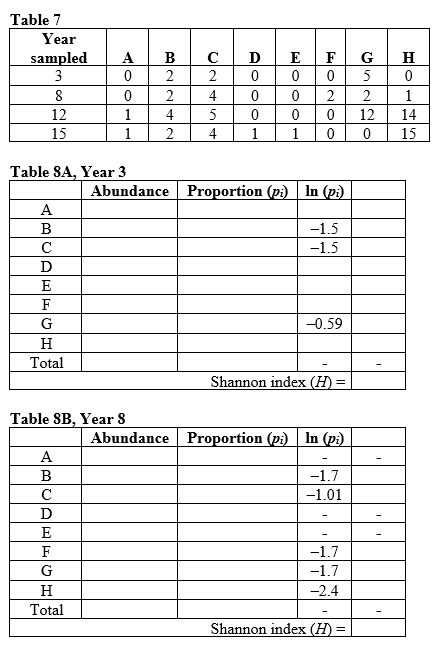
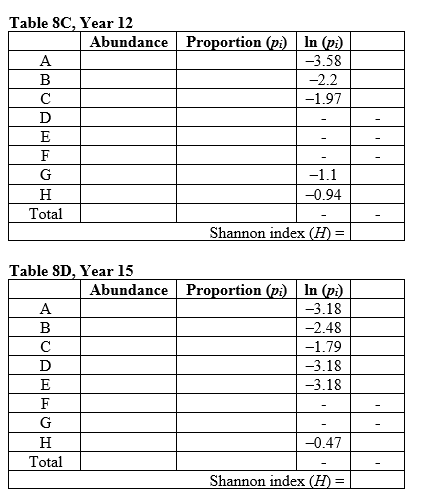
d) Calculate species richness and diversity for years 3, 8, 12, and 15 based on the data in Table 7. Calculate the Shannon index of species diversity, using Table 8 (supplied) to enter your data to create a new table (these will be referred to as Table 8A, Year 3; 8B, Year 8; 8C Year 12; and 8D, Year 15).
Definitions:
Infiltrated
The process of a substance or group discreetly entering or permeating an area or structure, often with harmful effects.
Diarrhea
Frequent, loose, or watery bowel movements often indicative of a gastrointestinal upset or infection.
Arterial Blood Gas
A test that measures the oxygen and carbon dioxide levels in arterial blood, often used to assess lung function and gas exchange efficiency.
Intravenous Site
The specific location on the body where a needle is inserted into a vein for the purpose of delivering medications or fluids.
Q6: Refer to the figure.<br><img src="https://d2lvgg3v3hfg70.cloudfront.net/TBO1115/.jpg" alt="Refer to
Q22: What is not an explanation for coexistence
Q25: Refer to the tables.<br> <img src="https://d2lvgg3v3hfg70.cloudfront.net/TBO1115/.jpg" alt="Refer
Q38: Refer to the figure.<br><img src="https://d2lvgg3v3hfg70.cloudfront.net/TBO1115/.jpg" alt="Refer to
Q40: Which statement about food webs is false?<br>A)
Q42: Which principle is best illustrated by Erickson's
Q52: Refer to the figure.<br><img src="https://d2lvgg3v3hfg70.cloudfront.net/TBO1115/.jpg" alt="Refer to
Q53: Two populations (population 1 and population 2)
Q63: A nutrient-poor lake with low primary productivity
Q77: Individuals of a plant species are counted