Refer to the figure.
Figure 1
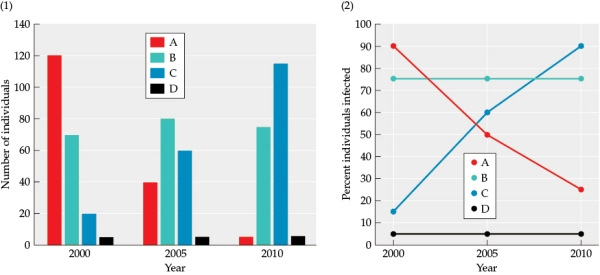 The figure shows data collected on a species of fish that lives on a coral reef. The fish were captured and studied three times-in 2000, 2005, and 2010. Four genotypes were found in an area of the coral reef (shown as A, B, C, and D). The figure shows: (1) the number of individuals of each genotype captured during each year, and (2) the percent of individuals infected with parasites captured during each year.
-Answer the following questions:
a) Graph the relationship between the numbers of individuals of different genotypes and
the percent of infected individuals (this will be referred to as Figure 4). Refer to data on population size and percent of individuals infected by genotype. For simplicity, graph all of the data from all of the years on the same plot as points on a scatter graph. Sketch a line that fits the relationship between population size and percent infected.
b) What does this data tell you about the likely relationship between genotype, numbers of individuals, and the percent infected individuals?
Definitions:
Poverty
A socio-economic condition characterized by a lack of financial resources and access to basic needs such as food, shelter, and healthcare.
Socioeconomic Status
A combined measure that typically includes a person's income, education level, and occupation to classify their position within society.
Internal Stratification
The division of a society or group into different levels or statuses, based on socio-economic conditions or other criteria, occurring within a particular society or entity.
International Stratification
The hierarchical arrangement of countries or nations based on economic, social, or political criteria, leading to inequalities in wealth, power, and status.
Q2: Which statement about logistic growth is false?<br>A)
Q18: Suppose you are studying a species of
Q25: Which scenario would likely result in the
Q34: The table shows the survivorship, fecundity,
Q45: Two species of sparrows are competing, and
Q48: Which statement about parasitic fungi, such as
Q65: You are studying a population of a
Q65: Which species in the figure is
Q68: At which stage of succession is facilitation
Q70: According to the _ model of succession,