The following question are based on the following graph. The curves D and S represent the market demand and supply curves for farm products in 1960. The curves D₁ and S₁ represent the market demand and supply curves for farm products in 2000. It is supposed that there were no support programs in either year.
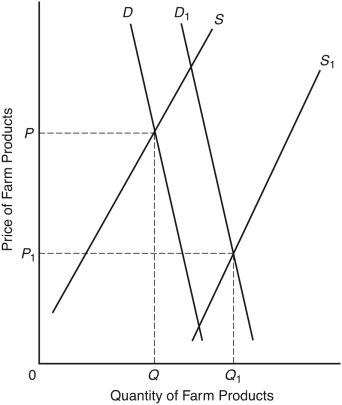
-The relatively large shift in the supply curve over the 40 years illustrates that
Definitions:
Inventory Turnover
A ratio showing how many times a company's inventory is sold and replaced over a specific period, indicating its efficiency in managing and selling stock.
Liquidity
The ease with which an asset can be converted into cash without significantly affecting its market price.
Days In Inventory
A financial metric that indicates the average number of days a company takes to turn its inventory into sales.
Credit Sales
Sales made by a business where the payment is delayed as per an agreement between the buyer and the seller.
Q12: Antitrust action against the American Telephone and
Q19: There is neither excess supply nor excess
Q24: Experience with public regulation of monopolies indicates
Q38: In addition to preferences,a consumer's choice is
Q42: Under which condition is the checkoff legal?<br>A)
Q49: The average product of the fourth unit
Q55: A variable input is one that<br>A) is
Q60: The Sherman Act<br>A) outlawed conspiracy in restraint
Q63: Economic growth is an increase in<br>A) population.<br>B)
Q73: If the price of the product is