Figure 8.1 depicts the supply and demand schedules of calculators for Greece,a "small" country that is unable to affect the world price.Greece's supply and demand schedules of calculators are respectively depicted by SG and DG.Assume that Greece imports calculators from either Germany or France.Suppose Germany is the world's low-cost producer who can supply calculators to Greece at $20 per unit,while France can supply calculators at $30 per unit.
Figure 8.1.Effects of a Customs Union
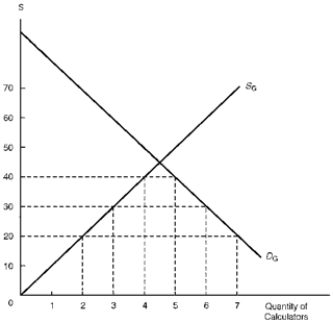
-Consider Figure 8.1.Comparing the trade creation and trade diversion effects,the impact of the Greece/France customs union on the welfare of Greece is:
Definitions:
Perfectly Elastic
Describes a situation where the quantity demanded or supplied reacts extremely to a small change in price, indicating infinite responsiveness.
Demand Curve
A graph representing the relationship between the price of a good or service and the quantity demanded by consumers at those prices.
Price Elasticity
A measure of how much the quantity demanded of a good responds to a change in its price, indicating the sensitivity of consumers to price changes.
Demand Curves
Graphical representations showing the relationship between the price of a good and the quantity demanded by consumers at those prices.
Q1: According to the General Agreement on Tariffs
Q6: Adjustment assistance is sometimes used to assist:<br>A)
Q7: In the interbank market for foreign exchange,
Q10: That German investors collect interest income on
Q16: The most recent round of multilateral trade
Q34: Those who argue in favor of import
Q69: A reason why it is difficult for
Q71: Consider Figure 8.1. The value of the
Q86: Describe the flying-geese pattern of economic growth?
Q116: Consider Table 4.1. Prior to the tariff,