As part of the quarterly reviews, the manager of a retail store analyzes the quality of customer service based on the periodic customer satisfaction ratings (on a scale of 1 to 10 with 1 = Poor and 10 = Excellent). To understand the level of service quality, which includes the waiting times of the customers in the checkout section, he collected the following data on 100 customers who visited the store.

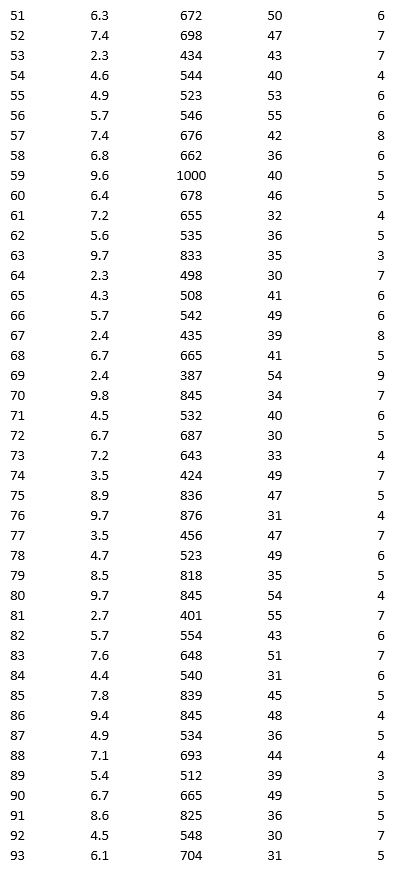
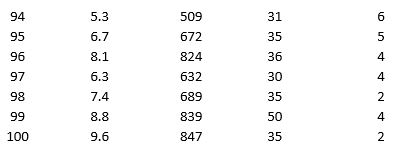
For the above data, apply k-means clustering using Wait time (min) as the variable with k = 3. Be sure to Normalize input data, and specify 50 iterations and 10 random starts in Step 2 of the XLMiner k-Means Clustering procedure. Then create one distinct data set for each of the three resulting clusters for waiting time.
a. For the observations composing the cluster which has the low waiting time, apply hierarchical clustering with Ward's method to form two clusters using Purchase Amount, Customer Age, and Customer Satisfaction Rating as variables. Be sure to Normalize input data in Step 2 of the XLMiner Hierarchical Clustering procedure. Using a PivotTable on the data in HC_Clusters, report the characteristics of each cluster.
b. For the observations composing the cluster which has the medium waiting time, apply hierarchical clustering with Ward's method to form three clusters using Purchase Amount, Customer Age, and Customer Satisfaction Rating as variables. Be sure to Normalize input data in Step 2 of the XLMiner Hierarchical Clustering procedure. Using a PivotTable on the data in HC_Clusters, report the characteristics of each cluster.
c. For the observations composing the cluster which has the high waiting time, apply hierarchical clustering with Ward's method to form two clusters using Purchase Amount, Customer Age, and Customer Satisfaction Rating as variables. Be sure to Normalize input data in Step 2 of the XLMiner Hierarchical Clustering procedure. Using a PivotTable on the data in HC_Clusters, report the characteristics of each cluster.
Definitions:
M+2 Peak
In mass spectrometry, this peak results from molecules containing two isotopes heavier than the most common isotopes (such as two chlorines), indicating the presence of elements like Sulfur or Chlorine.
MS Peak
A peak observed in a mass spectrum, representing ions of a specific mass-to-charge ratio.
Mass Spectrum
A graph or data set representing the distribution of ions by mass in a sample, used to determine the molecular weight and structure of compounds.
M/Z = 43
Represents the mass-to-charge ratio of 43 in mass spectrometry, indicative of a specific fragment's mass.
Q6: Lines showing the alternatives from decision nodes
Q8: Reference - 10.1. Which of the following
Q8: Which of the following is a document
Q9: The estimation of the value for a
Q11: A research team wanted to assess the
Q16: A mutation of the gene encoding the
Q31: The income levels vary by race and
Q39: Starsystems is a small information systems company
Q48: The process of _ might be used
Q50: The _ function pairs each element of