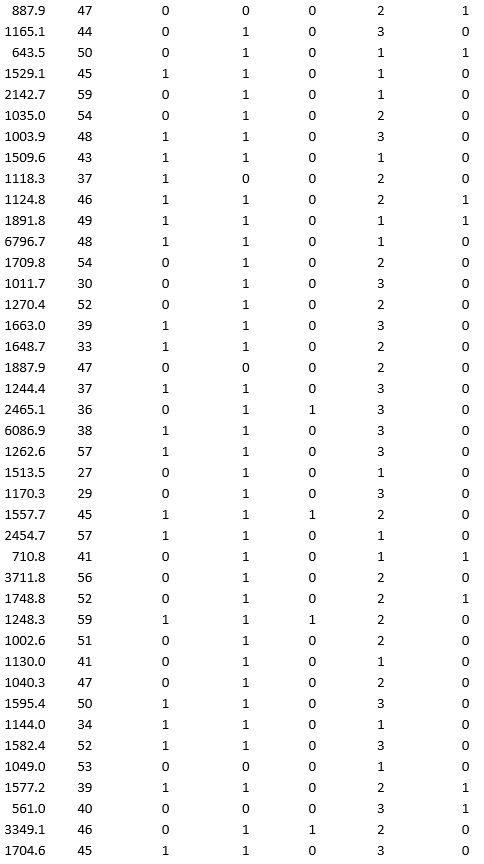
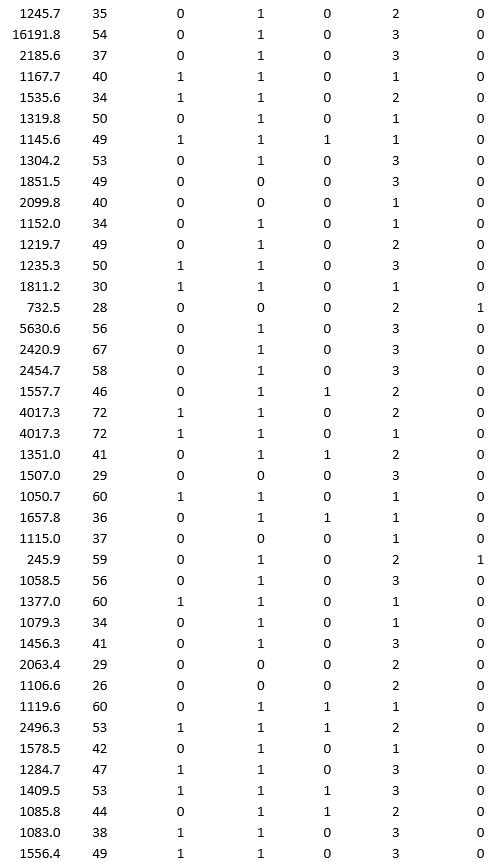
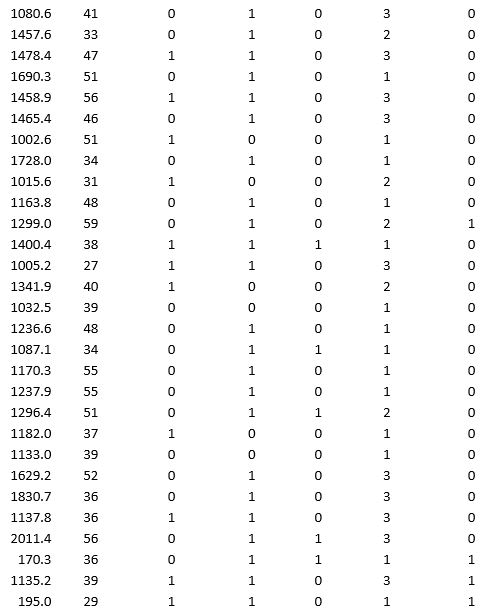
A bank wants to understand better the details of customers who are likely to default the loan. In order to analyze this, the data from a random sample of 200 customers are given below:

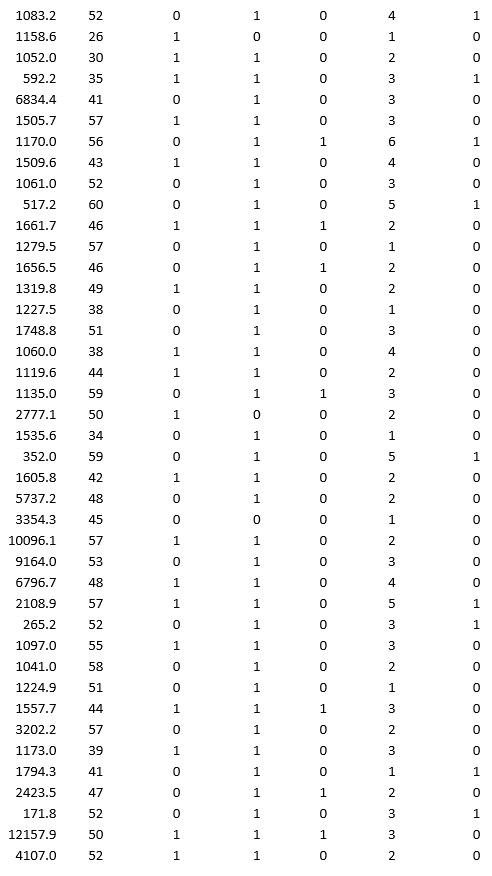
In XLMiner's Partition with Oversampling procedure, partition the data so there is 50 percent successes (Loan default) in the training set and 40 percent of the validation data is taken away as test data. Classify the data using k-nearest neighbors with up to k = 10. Use Loan default as the output variable and all the other variables as input variables. In Step 2 of XLMiner's k-nearest neighbors Classification procedure, be sure to Normalize input data and to Score on best k between 1 and specified value. Generate lift charts for both the validation data and test data.
a. For the cutoff probability value 0.5, what value of k minimizes the overall error rate on the validation data?
b. What is the overall error rate on the test data? Interpret this measure.
c. What are the Class 1 error rate and the Class 0 error rate on the test data?
d. Compute and interpret the sensitivity and specificity for the test data.
e. Examine the decile-wise lift chart on the test data. What is the first decile lift on the test data? Interpret this value.
Definitions:
Outline Pane
A feature within many applications that displays a document's structure in a simplified, easy-to-navigate format.
Slide Pane
A section of the user interface in presentation software that shows a thumbnail preview of slides, facilitating easy navigation and organization.
Split Them
Dividing or separating a single object or text into multiple parts.
Table Row
A horizontal grouping of cells within a table, often used to represent a single record or entry.
Q3: Carcinoma of the esophagus most often presents
Q7: The process of reducing the number of
Q12: Consider the below data on 30 different
Q19: The data dashboard for a marketing manager
Q20: An electronics store sells two models of
Q20: A bank wants to understand better the
Q24: In a(n) _ relationship between two quantities,
Q42: In a base-case scenario, the output is
Q48: An observation classified as part of a
Q60: Andrew is ready to invest $200,000 in