Figure 1 illustrates an election in which there are seven voters (A, B, C, D, E, F, G) arrayed along a single left-right issue dimension that runs from 0 (most left) to 10 (most right) . Each voter is assumed to have a single-peaked preference ordering over the issue dimension and to vote for the party that is located closest to her ideal point. The voters are participating in a majority rule election in which there are two parties, P1 and P2, competing for office. These parties can be thought of as "office-seeking" parties since they only care about winning the election and getting into office.
Figure 1: Illustrating the Median Voter Theorem
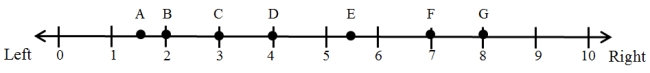
-Now suppose that P1 locates at position 4 on the left-right issue dimension and that P2 locates at position 4. Who wins the election in the situation illustrated by Figure 1?
Definitions:
AVC Curve
A graphical depiction of the average variable costs incurred by a firm in the short run, illustrating how costs vary with output levels.
AFC Curve
A graph representing Average Fixed Costs, which shows how fixed costs per unit of output decrease as production increases.
Total Cost Function
An equation that expresses the total cost of producing a given quantity of output, considering both fixed and variable costs.
Average Total Cost
The total cost of production divided by the number of units produced, signifying the cost per unit of output.
Q1: A minimalist conceptualization of democracy classifies a
Q1: Out of the six lessons discussed, which
Q2: When comparing the scores on a satisfaction
Q4: All of the following can be guided
Q5: Imagine that a scholar wants to develop
Q9: Which stage of the product life cycle
Q11: If we found evidence that economic development
Q39: What does it mean for a social
Q44: Major premise: If a country's electoral rules
Q46: "Religious faith assures a person a place