The following figure illustrates the market demand curve for wine.
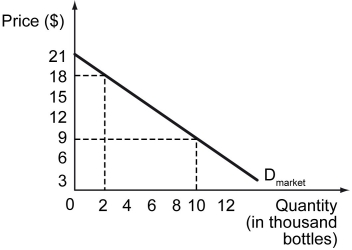
-Refer to the figure above.What is the market-wide consumer surplus when the market price of wine is $9 per bottle?
Definitions:
Interest Rate
An annual percentage rate representing the charge for borrowing a specific sum of money.
Financial Institutions
Organizations that provide financial services to customers, including banks, credit unions, insurance companies, and investment firms, facilitating money management and investment.
Capital Market
Financial markets where long-term debt or equity-backed securities are bought and sold, aiding in the raising of capital for entities.
Stock Market
A collection of markets where stocks (pieces of ownership in businesses) are bought, sold, and issued.
Q1: Refer to the scenario above.Maria should choose
Q12: Jenny likes chocolates.One day,a friend offers her
Q35: Which of the following statements is true
Q57: Which of the following is true for
Q57: Does optimization at the margin have any
Q65: Which of the following is the difference
Q111: Refer to the scenario above.Your total cost
Q175: Jack is a prospective buyer of a
Q203: The incentive for new firms to enter
Q256: Refer to the figure above.If the market