Multiple Choice
The consumption of a good entails a $2 positive external benefit per unit.The following graph shows the market supply and demand of this good.Which of the dashed lines represents the marginal social benefit curve?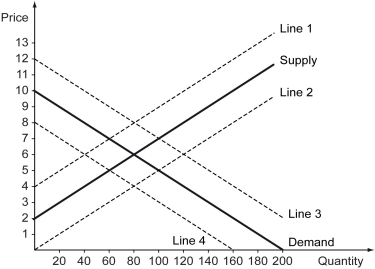
Describe factors affecting fertility and the impact of age on fertility.
Understand the causes and treatments for infertility.
Grasp the health habits that influence aging and reproductive health, including the effects of alcohol and obesity.
Be aware of demographic trends related to obesity in middle-aged adults.
Definitions:
Related Questions
Q8: Refer to the figure above.The producer surplus
Q27: In the graph above,the deadweight loss arising
Q46: Refer to the scenario above.What is Sarah's
Q48: Refer to the figure above.After the demand
Q115: Refer to scenario above.Could this externality problem
Q153: _ countries,in an effort to promote economic
Q180: Refer to the figure above.Which of the
Q188: Which of the following is true of
Q189: Refer to the figure above.At what level
Q209: Refer to the above scenario.This $2 price