The following figure shows the revenue and cost curves of a monopolist.
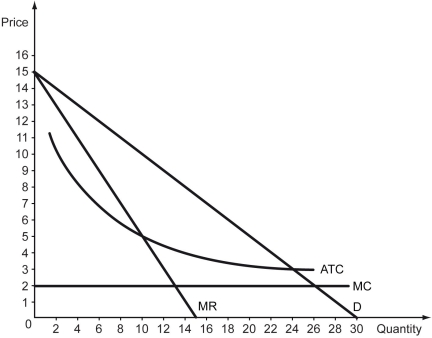
-Refer to the figure above.The consumer surplus in this market is ________,while the consumer surplus in the competitive circumstance would have been ________.
Definitions:
Supply Curve
A graphical representation showing the relationship between the price of a good and the quantity of the good that suppliers are willing to sell.
Inelastic
Describing a situation in which the demand or supply of a good or service is relatively unresponsive to changes in price.
Demand
The amount of a product or service that customers can and are willing to buy at different price levels over a specified time.
Supply
The total amount of a product or service that is available for purchase at any given price.
Q33: Diet Coke _ considered a product in
Q41: Refer to the scenario above.If the marginal
Q54: Refer to the scenario above.Suppose Mark can
Q65: Refer to the scenario above.If the hourly
Q71: Refer to the scenario above.Which of the
Q97: Perfect price discrimination is also referred to
Q181: Which of the following statements correctly identifies
Q200: Although the marginal productivity of hair stylists
Q217: For a monopolistically competitive firm,_.<br>A) Marginal revenue
Q295: In which of the following market structures