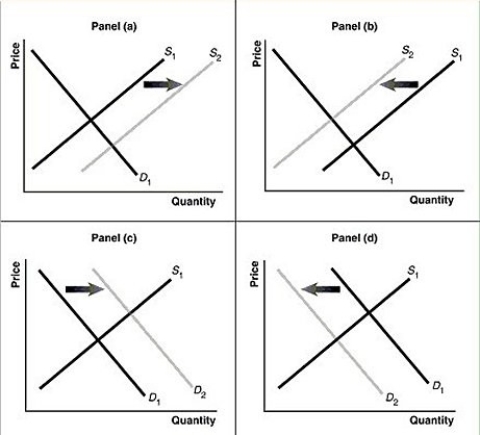
Figure 3-7

-Refer to Figure 3-7.Assume that the graphs in this figure represent the demand and supply curves for Fruitopia, a soft drink.Which panel describes what happens in the market for Fruitopia when the price of Snapple, a substitute product, decreases?
Definitions:
Sales Commissions
Financial rewards given to sales personnel based on the volume or value of sales they have achieved, serving as an incentive.
Piece-Rate Pay
A compensation system where employees are paid based on the quantity of units they produce or complete.
Decision-Making Responsibility
The obligation to make choices that affect an organization's performance and to bear the consequences of those choices.
More Tasks
A directive to undertake additional responsibilities or assignments.
Q38: According to an article in the Wall
Q80: Refer to Figure 4.4.The figure above represents
Q92: If 50 units are sold at a
Q104: Refer to Figure 2.11.Which two arrows in
Q122: Refer to Figure 3.8.The graph in this
Q123: Studies show that the income elasticity of
Q134: The cross-price elasticity of demand between an
Q134: Refer to Figure 5.3.The private profit maximizing
Q143: The demand for gasoline in the short
Q145: Explain the difference between a normal good